

Market-wide performance analytics on the entire outstanding SBA 7(a) guaranteed loan universe — drill down by geography, industry, lender, term, and origination vintage, then benchmark your portfolio against the market in seconds.
The data lenders, investors, and aggregators were piecing together from spreadsheets and stale quarterly reports, delivered as one continuously refreshed market view.
Boards and regulators evaluate performance through peer comparison. Show exactly how your segment stacks up against the full SBA 7(a) market — by term, balance, geography, or sector.
Vintage analysis reveals how default rates vary by origination year. Walk into a secondary-market bid knowing whether 2016–2020 vintages are still a problem — backed by data.
County-level intelligence surfaces pockets of credit stress that statewide numbers hide — changing how you underwrite and how you price on the secondary market.
See how balances are concentrating and shifting across sector, geography, lender, and loan structure, so you can position your origination mix ahead of the trend.
Eight interactive dashboards, ten-plus filter dimensions, and one-click export to CSV or Excel — feed your internal models and board reports without rebuilding the data.
Pool-level data refreshed monthly, with history reaching back to 2000 origination vintages — a living picture of the market instead of a quarterly snapshot.
From a market-wide panorama down to a single county, Q-SBA Benchmarks lets you move fluidly between the big picture and the precise question.
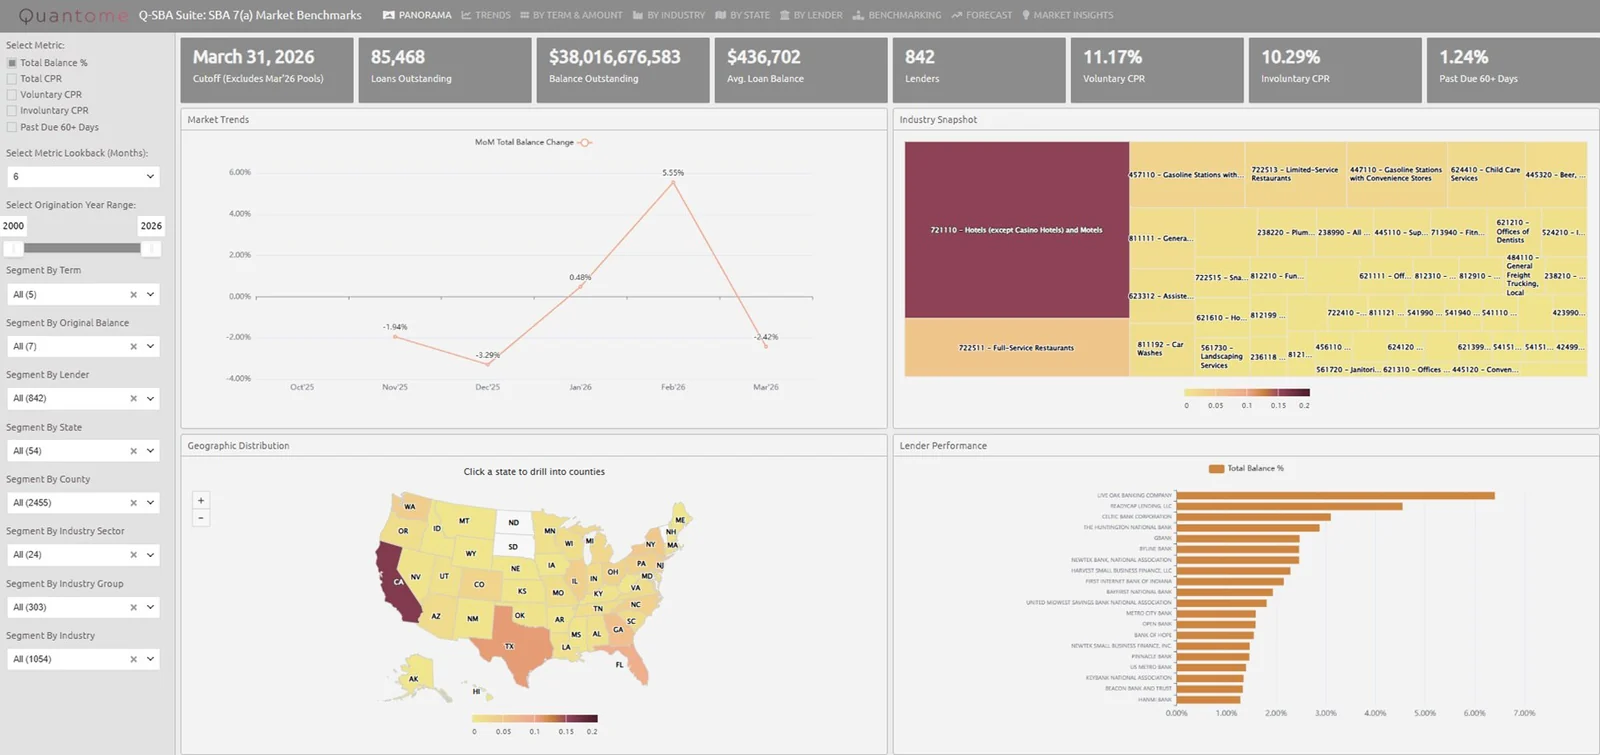
An instant read on the entire SBA 7(a) secondary market — total outstanding balance, loan counts, weighted-average coupon, prepayment speeds, and 60+ days past due, all on a single screen. Filter by term bucket, balance group, lender, state, county, sector, or NAICS code, and watch where balances concentrate and how the mix is shifting.
Benchmark your portfolio mix against the broader market in seconds — no spreadsheets, no waiting for quarterly reports.
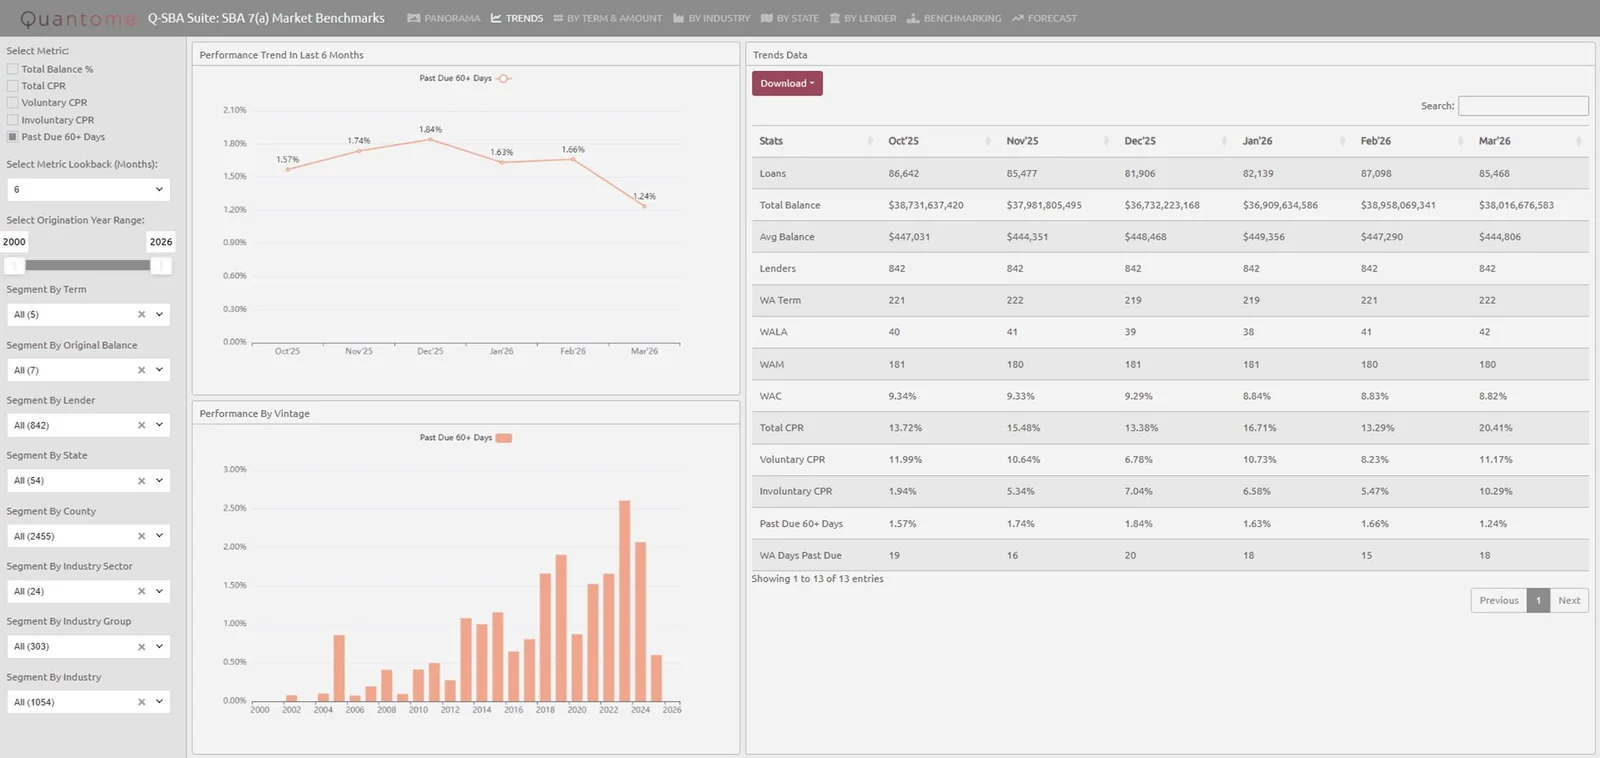
A six-month performance trend line paired with a full month-by-month table of loan counts, balances, WAC, CPR, involuntary prepayments, and 60+ days past due. Below it, the vintage chart reveals how delinquency varies by origination year — critical context for pricing seasoned pools or weighing a secondary-market bid.
When your credit committee asks "are 2019 vintages still a problem?", you answer with data in 10 seconds — not 10 days.
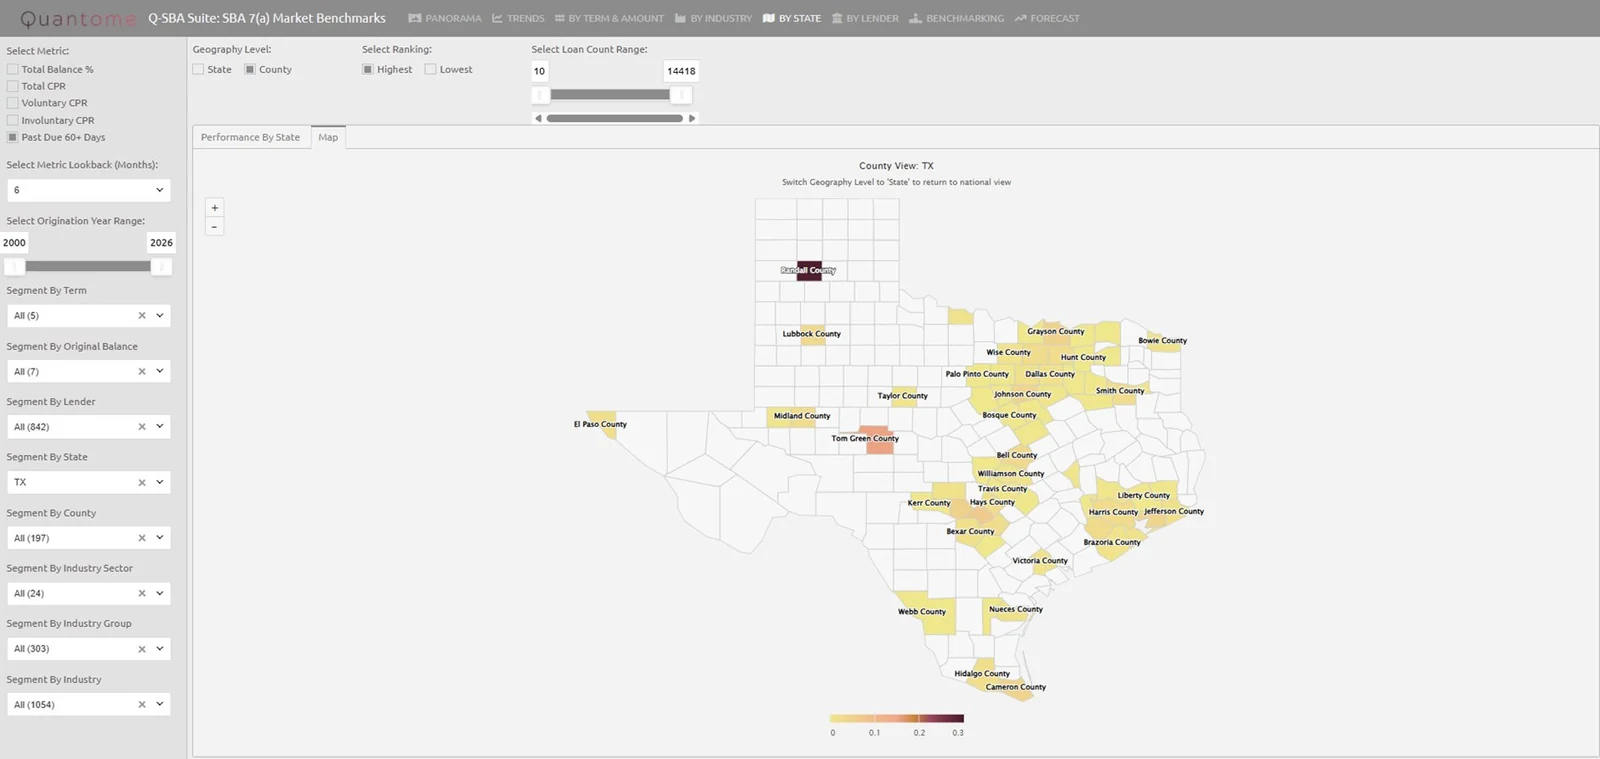
Start with a national heat map of 60+ days past due by state, then click any state to zoom to county-level granularity — revealing pockets of credit stress that state averages conceal. A loan-count slider filters out counties too thin to be meaningful, so every signal you see is statistically real.
If you originate in southern Maine, knowing York County differs from Penobscot County changes how you underwrite — and how you price.
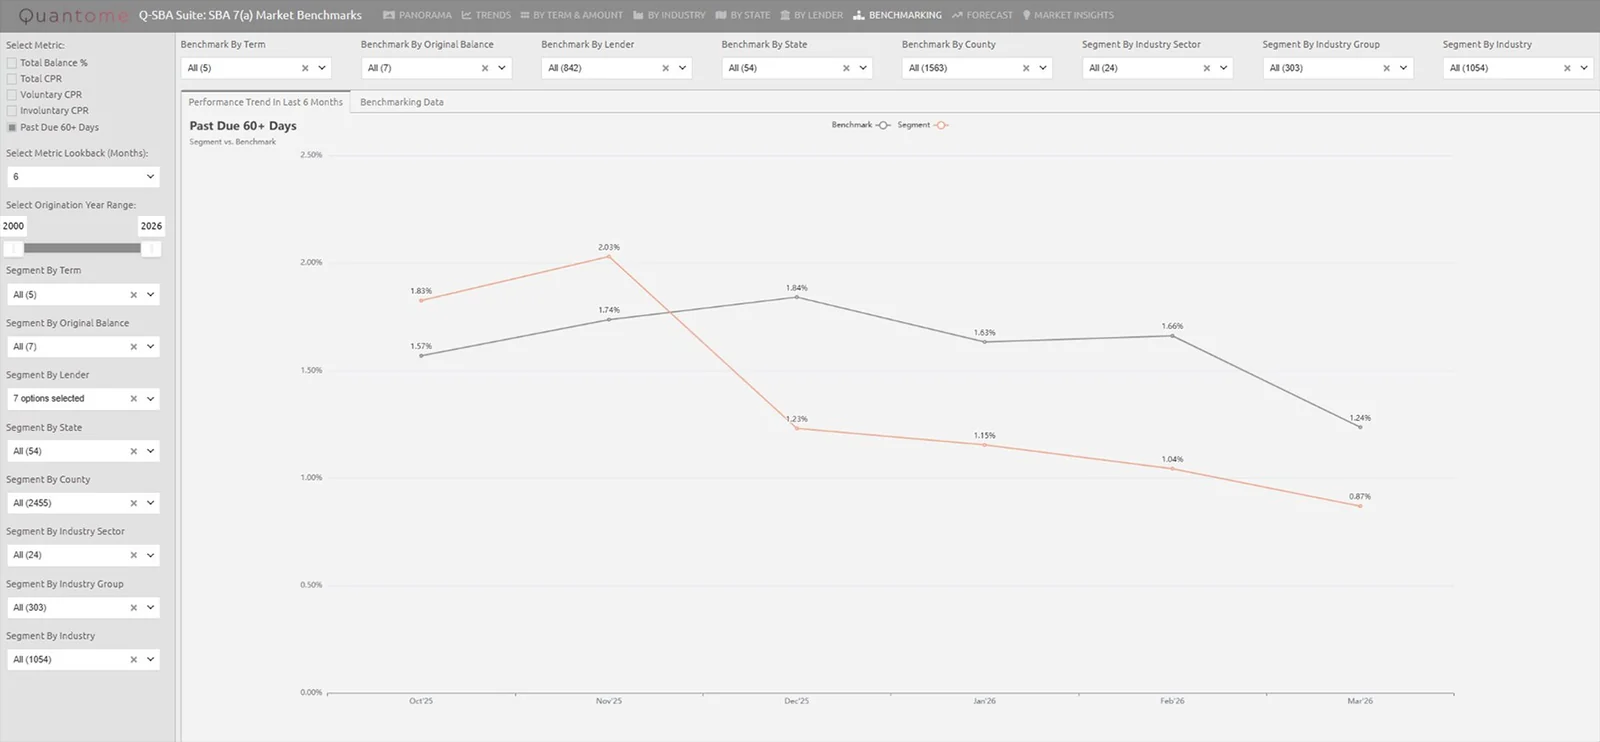
Overlay a selected segment's performance against the full market benchmark and see instantly where you run hotter, cooler, or in line. Compare across any combination of dimensions — term, balance, state, county, sector, or industry — to ask precise questions like "how do our 10–15 year, $350K–$750K Florida loans compare to the rest of the market?"
Peer comparison is how boards and regulators evaluate performance. This gives your SBA team the answer before the question is asked.
Everything an SBA team needs to monitor the market, defend performance, and price with conviction.
Panorama, Trends, By Term & Amount, By Industry, By State, By Lender, Benchmarking, and Forecast.
Total Balance %, Total CPR, Voluntary CPR, Involuntary CPR, 60+ Days Past Due, and WA Days Past Due.
Term, original balance, lender, state, county, industry sector, group, NAICS code, vintage, and lookback window.
Pool-level data updated monthly, with historical coverage reaching back to 2000 origination vintages.
Download any view's underlying data as CSV or Excel for internal models and board reports.
Branded benchmarking reports for any lender — peer comparison and market positioning, ready to present.
Request a walkthrough of Q-SBA Benchmarks and see your portfolio against the full SBA 7(a) universe.
Request a Demo